


How to Spot The Bottom with Confidence During A Market Correction
Use The Money Flow Trading System to pinpoint market structure and prepare for stage 1 entries.


Hey, MFG!!🤘
YES!! YES!! YES!!
"Someone once observed that the difference between the rich and the poor is that the rich invest their money and spend what’s left, while the poor spend their money and invest what’s left."
Market corrections and selloffs are not setbacks—they're blessings and opportunities.
This is when real wealth is built.
The stock market only declines about 29% of the time—and we’re in that rare window right now.
For those who’ve mastered the psychology of the markets, this is an exciting time to be a participant.
Why? Because while most people panic, disciplined traders and investors prepare.
These moments of fear are the exact environments where anchor points begin to form, market structure takes shape, and future fortunes are made.
We need the market to come down so we can position ourselves for the next big move up.
This is a season of opportunity and abundance—and those who understand how the game is played are already watching, planning, and positioning.
Right now, the major 3 indexes are in a stage 4 decline below their 200-day SMA—a classic downtrend marked by fear, volatility, and uncertainty.
It’s the kind of environment that exposes weak hands, punishes impatience, and tests every trader’s resolve.
Market sell-offs show the true person that you are.
And while it might feel tempting to jump into every bounce, the real pros know: the real opportunity comes when structure forms.
This weekend’s article is a breakdown about of one of the most powerful concepts in The Money Flow Trading System: Anchor Points.
If you can identify them, you’ll never have to guess again about where to buy.
-GP a.k.a Fullauto11 🧙🐼
👉GAIN EXCLUSIVE ACCESS TO GP’S TRADE OF THE WEEK!!👇
Unlock exclusive insights and advanced strategies by becoming a paid subscriber to The Peters Report. Stay one step ahead of the market with in-depth analysis and actionable tips designed to help you succeed as a trader and investor. Support the work that keeps you informed and ahead of the curve.
How to Spot The Bottom with Confidence During A Market Correction
Anchor Points help us read the market’s structure, spot real bottoms, and prepare for the next wave higher.
If you can identify them, you’ll know when to buy.
Why Anchor Points Matter
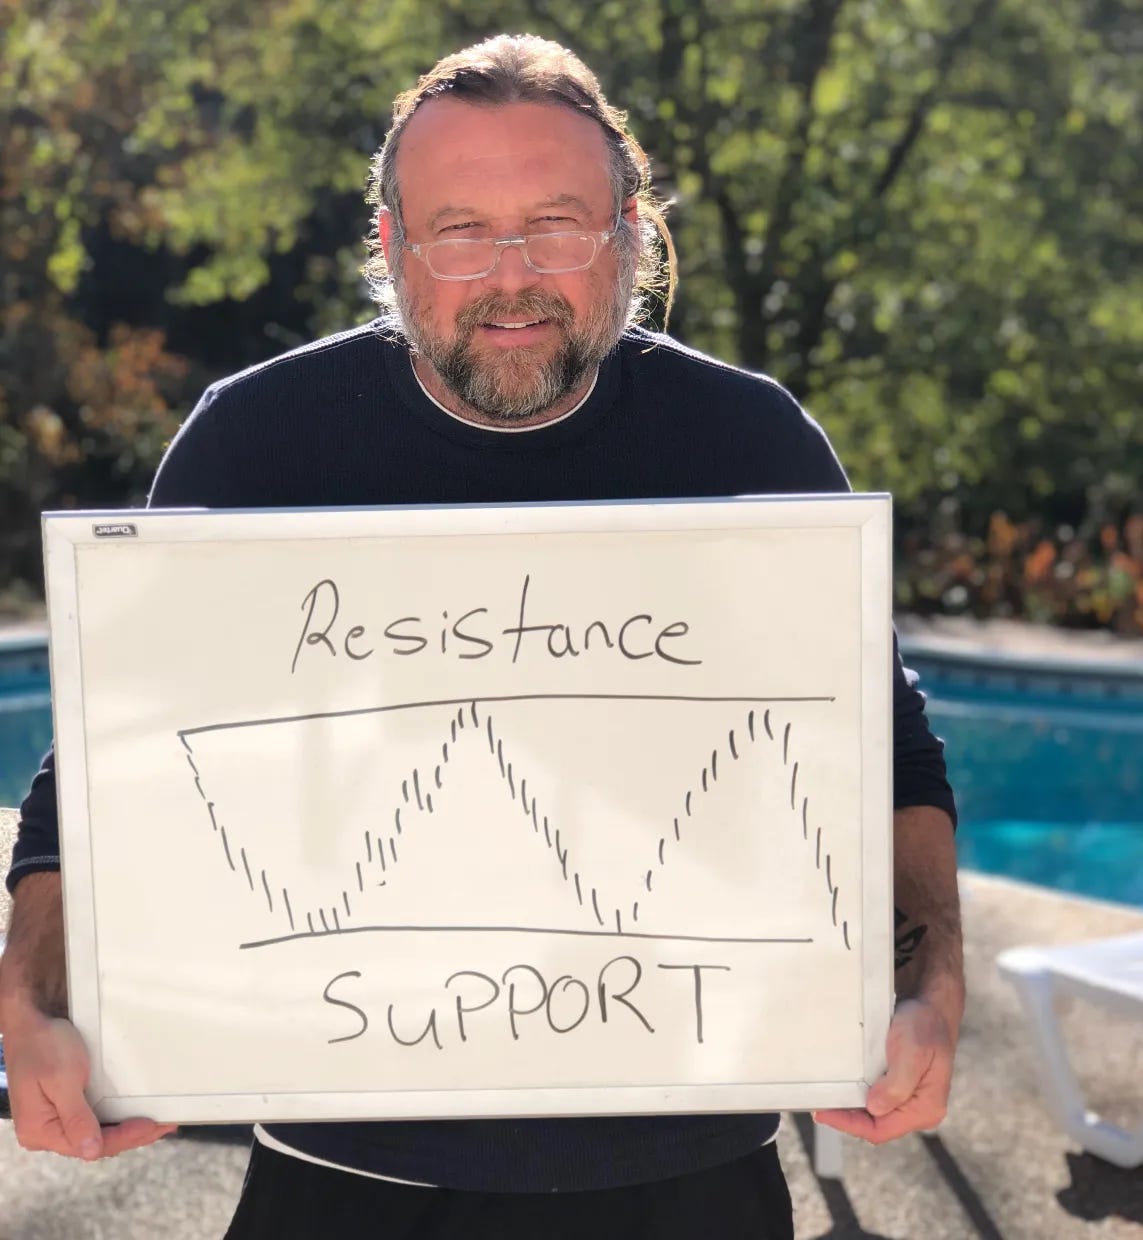
An anchor point is a specific price level where the market establishes a clear structural low; its the lowest low.
It’s the first sign of stability after a sell-off.
Just like a ship drops its anchor to stop drifting, the market drops an Anchor Point when price stops bleeding and begins to level out.
In The Money Flow Trading System, anchor points are used to:
Tag the bottom of a structured move
Build a trading box, a stage 1 accumulation zone
Identify trend reversals and turning points
Set precise stop losses based on structure, not random percentages
Give traders a level they can confidently build positions against

How to Spot an Anchor Point in Real Time
You’re not guessing the bottom—you’re watching for it to form.
Anchor points are confirmed through price action and momentum shifts.
🐼🤘🏼Here’s how I do it:
Price drops and forms a notable low- this could be the anchor, if price closes above it the next day, the anchor point is established.
→ This is the moment the market potentially drops its anchor.Price moves sideways for 3–4 days
→ You’re looking for consolidation, not continuation. This pause means the market is trying to find footing.RSI dips into extreme-low territory (RSI<30)
→ Oversold conditions signal that the sellers may be drying up. I love seeing the RSI hit its lowest levels here. This is a perfect Money Flow bottom.Price closes above the 5-day EMA
→ That’s the trigger. This signals short-term momentum has flipped and the stage 1 accumulation zone is confirmed.
When all four elements align—price movement, time, the RSI and the 5-day EMA—you’ve got a high-conviction anchor point.
This is your go-ahead to open a swing trade or build an early position in a longer-term move.
Money Flow Anchor Points in Action
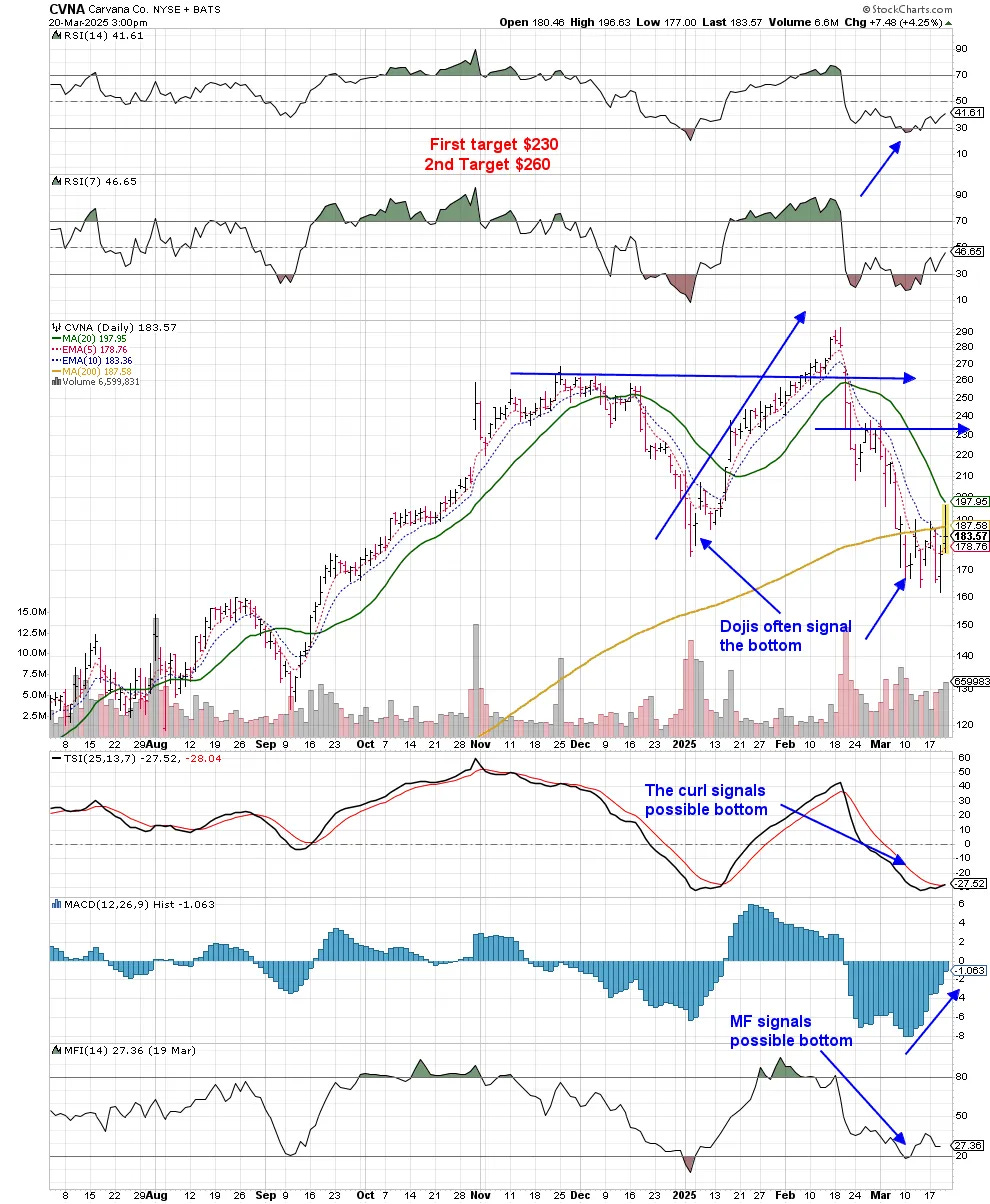
Price drops a anchor point on an extreme-low RSI reading (<30), the next day price closes above it with a doji, then moves sideways 3-4 days and jumps above its 5-day EMA.
This is a Money Flow stage 1 confirmation and exactly the type of setup I look for at the bottom of a sell-off.
Here is a video of G breaking down anchor points:
The Path From Stage 4 to Stage 1
As we work through this Stage 4 decline, your #1 job is to observe.
RSI bottoming
Anchor points forming across multiple stocks
Sideways price action for 3-4 days
Price reclaiming the 5-day EMA
These are early signals that the next phase—Stage 1 accumulation—is beginning.

G’s Wrap-Up
Anchor Points are The Signal, Not the Drama from the News!!
The market is giving us what we need—volatility, fear, and opportunity.
This is the time when real traders get excited, not scared.
If you’ve developed the discipline and mastered the psychology of the market, you know: this isn’t the time to sit back—it’s the time to study price, watch for anchor points, and prepare.
We’re not here to predict bottoms.
We’re here to recognize structure, wait for confirmation, and move with conviction when the moment arrives. That’s the edge. That’s The Money Flow way.
So while most are shaken by the sell-off, we’re sharpening our skills, building our plan, and staying alert. Because when that next Stage 1 box forms… we’ll be ready.
Stay patient. Stay prepared. And above all—trade with purpose, MFG!!
Always remember, whatever you think about comes about, whatever you focus on grows. - GP 🐼🧙🤘
The Peters Report - Stock & Crypto Trader’s Resource
Always remain bullish and follow The Money Flow.
Join The MFG Trading Community & Text Alerts🐼🚨
Looking for a group of likeminded people to trade with? Text alerts and the MFG Discord. Text GP 1-936-661-7786 or email GP fullauto11@gmail.com to join.
CLICK HERE to access GP’s Trade Ideas chart pack for FREE on StockCharts!!
Stay Up To Date 👇🌊


Mastering The Trade The Money Flow Way Podcast with Gerald Peters on Spotify
The Science of Getting Rich Podcast with Gerald Peters on Spotify
NEW to trading and investing in stocks? Want a crash course? 12 videos and a 50 page manual- Getting Started with Stock Charts- The Money Flow Way: The Swing & Position Trading and Investment Blueprint. CLICK HERE
We have a beautiful opportunity here.
🐼 🐼🐼🐼🐼🐼🐼🐼🐼🐼🐼🐼