Support & Resistance The Money Flow Way
Learn how these key levels impact market trends and decision-making
Hey MFG!
We had another great day in the markets!
The leading asset class of The Wind, the Nasdaq (QQQ), set a new all-time high and is now trading at an extreme-high RSI reading. Use caution here. The S&P 500 (SPY) following right behind climbed a bit higher and is trading at a near extreme-high RSI reading.
The Dow Jones (DIA) and Gold (GLD) are still in stage 1 accumulation zones. Bitcoin (BTC) looks to be rolling over into a possible stage 4 decline. Bonds (TLT) are still in a stage 2 uptrend above its 200-day SMA. OIL (USO) broke out; the MFG timed the trade perfectly!
Make sure to get on the NEW PLATFORM email list! CLICK HERE!
I’ve crushed it this week so far trading TQQQ and GME. I hope you did your Sunday homework!! This article is a deep dive into support and resistance, which is at the core of the Money Flow Trading System.
Grab a free copy of Gerald’s ebook You Don’t Have To Die Broke! CLICK HERE!
Always remain bullish and follow The Money Flow.
The Peters Report - Stock & Crypto Trader’s Resource
-GP a.k.a Fullauto11
MFG Trade Updates
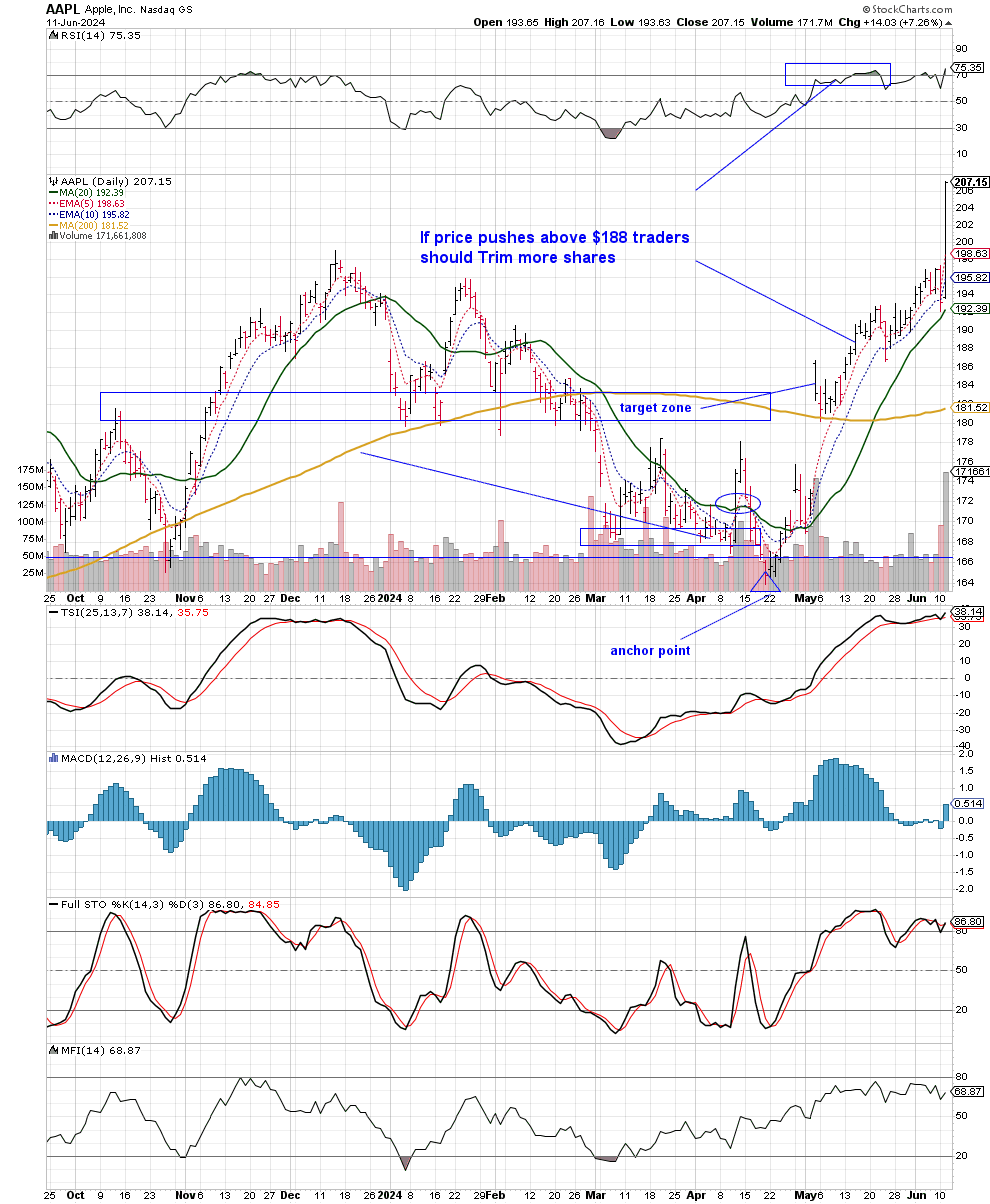
AAPL Trade Update
It’s time to trim AAPL again!! Congratulations to you in the AAPL (AAPB, AAPU, AAPX) trades!!
AAPL stocks soared over 7% the next day after its AI presentation at the Worldwide Developers Conference (WWDC).
[See AAPL chart below.]
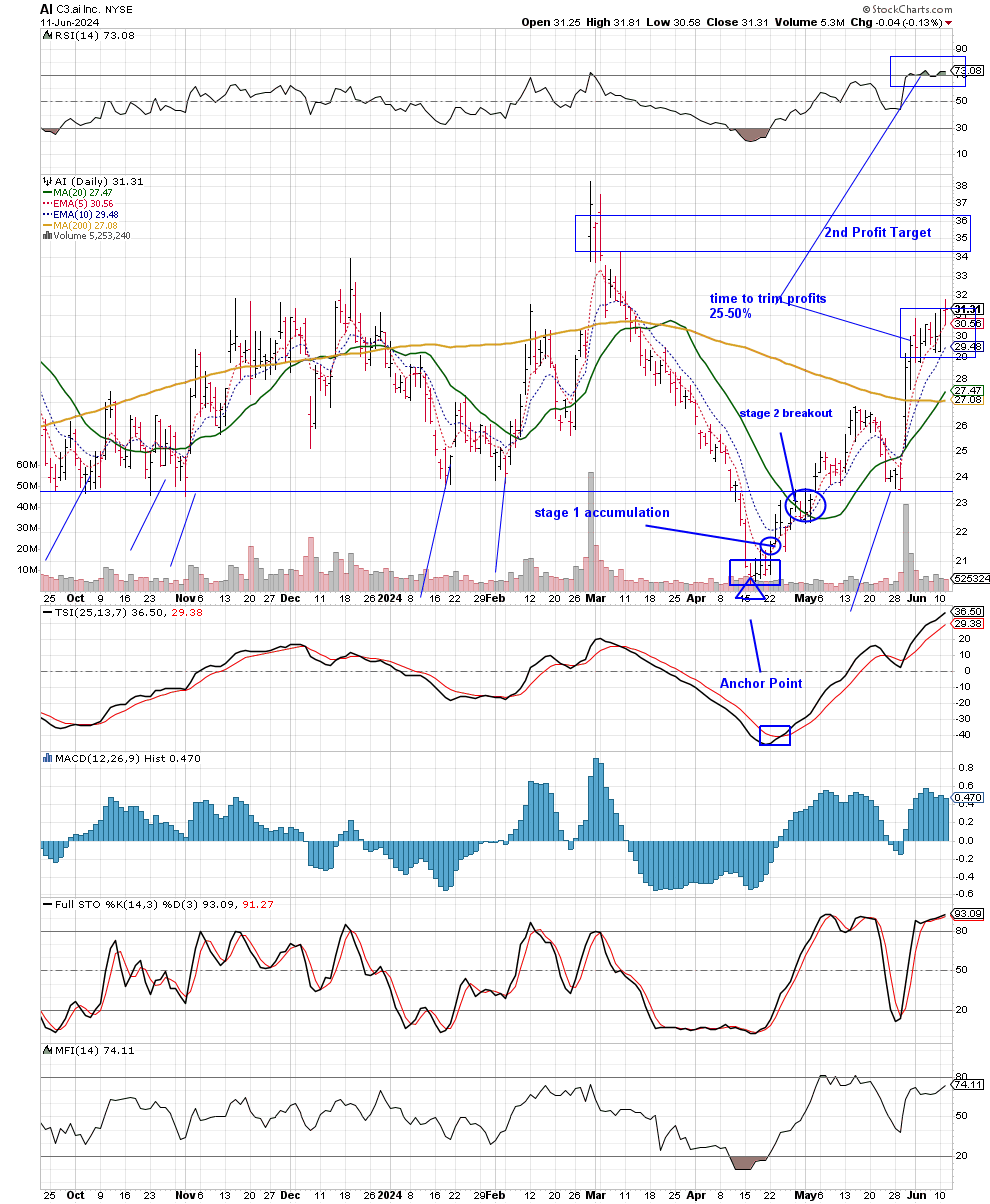
AI Trade Update
AI is hitting an extreme-high RSI. Now is the time to trim. I’ve taken profits and now am watching for my 2nd profit target. Congratulations to you in the AI trade!!
[See AI chart below.]
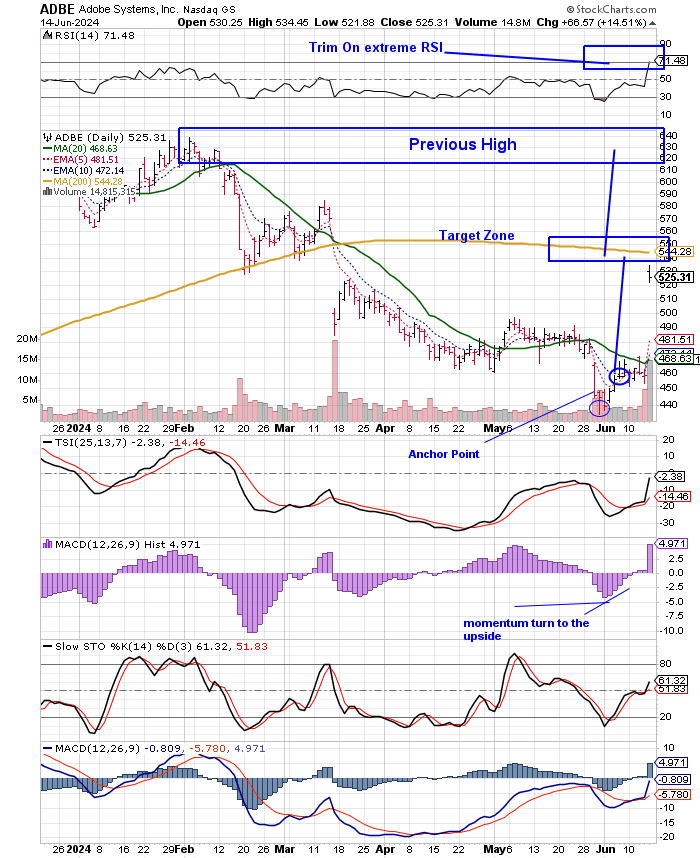
ADBE Trade Update
ADBE shares popped and price banged an extreme-high RSI. I trimmed some shares. Congratulations to you in the ADBE trade!!
[See ADBE chart below.]
Looking for a group of likeminded people to trade with? Text alerts and the MFG Discord. Text GP 1-936-661-7786 or email GP fullauto11@gmail.com to join.
Support & Resistance The Money Flow Way
Support & Resistance
"Support" and "resistance" are key concepts used in technical analysis to determine the price levels on a chart at which a stock is likely to reverse its direction.
Support refers to the price level at which a stock typically stops falling and bounces back up. This happens because demand increases as the price becomes more attractive to buyers. In essence, support levels indicate a concentration of buyers.
Resistance, on the other hand, is the price level at which a stock usually stops rising and begins to fall. This occurs because supply (selling interest) exceeds demand when the price reaches a certain higher level. Resistance levels indicate a concentration of sellers.
Traders use these levels to make decisions about buying or selling stocks, setting stop-loss orders, and identifying potential breakout points.
For example, a stock price breaking through resistance may signal a potential bullish trend, while breaking below support could indicate a bearish trend.
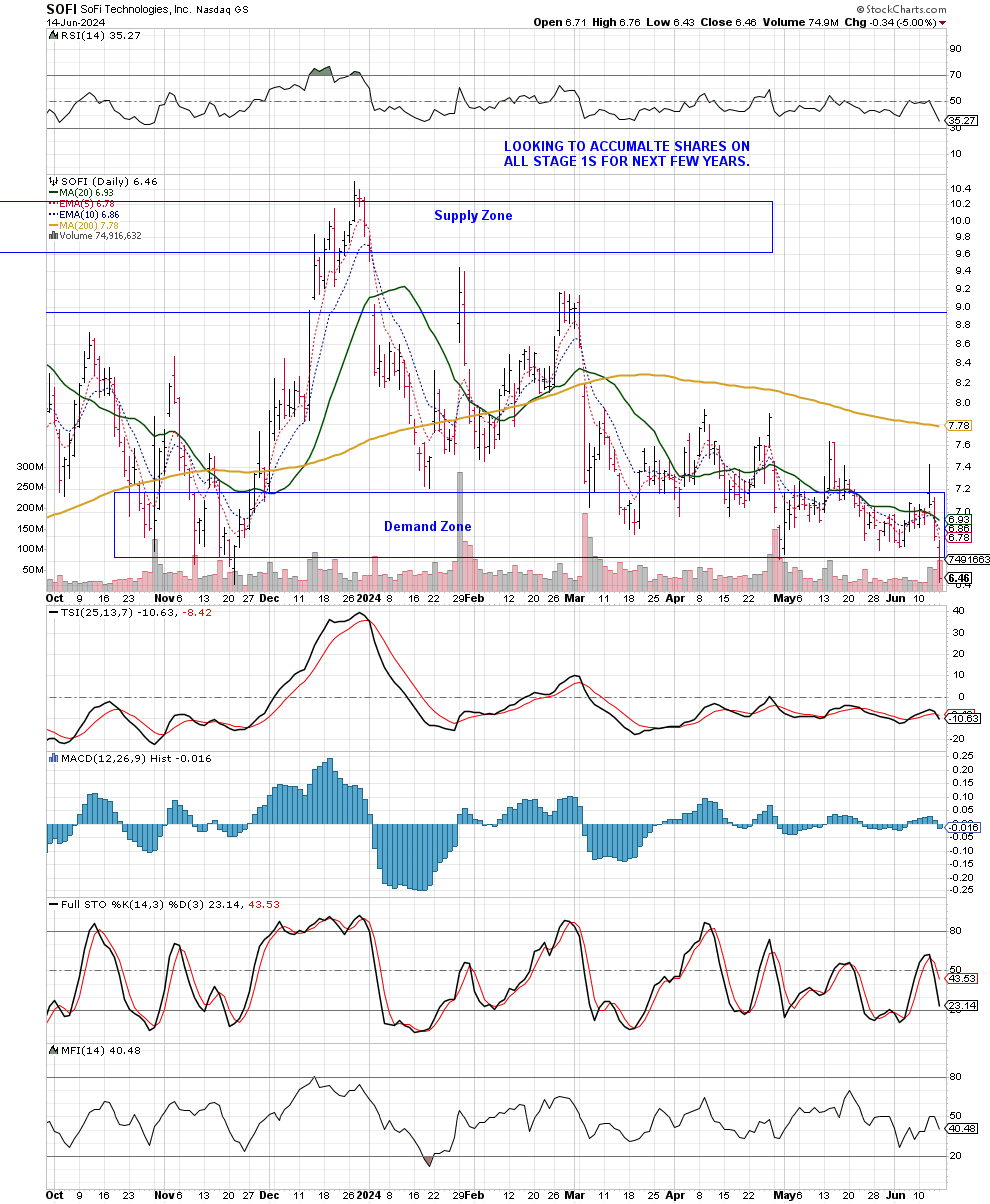
Support as a Demand Zone
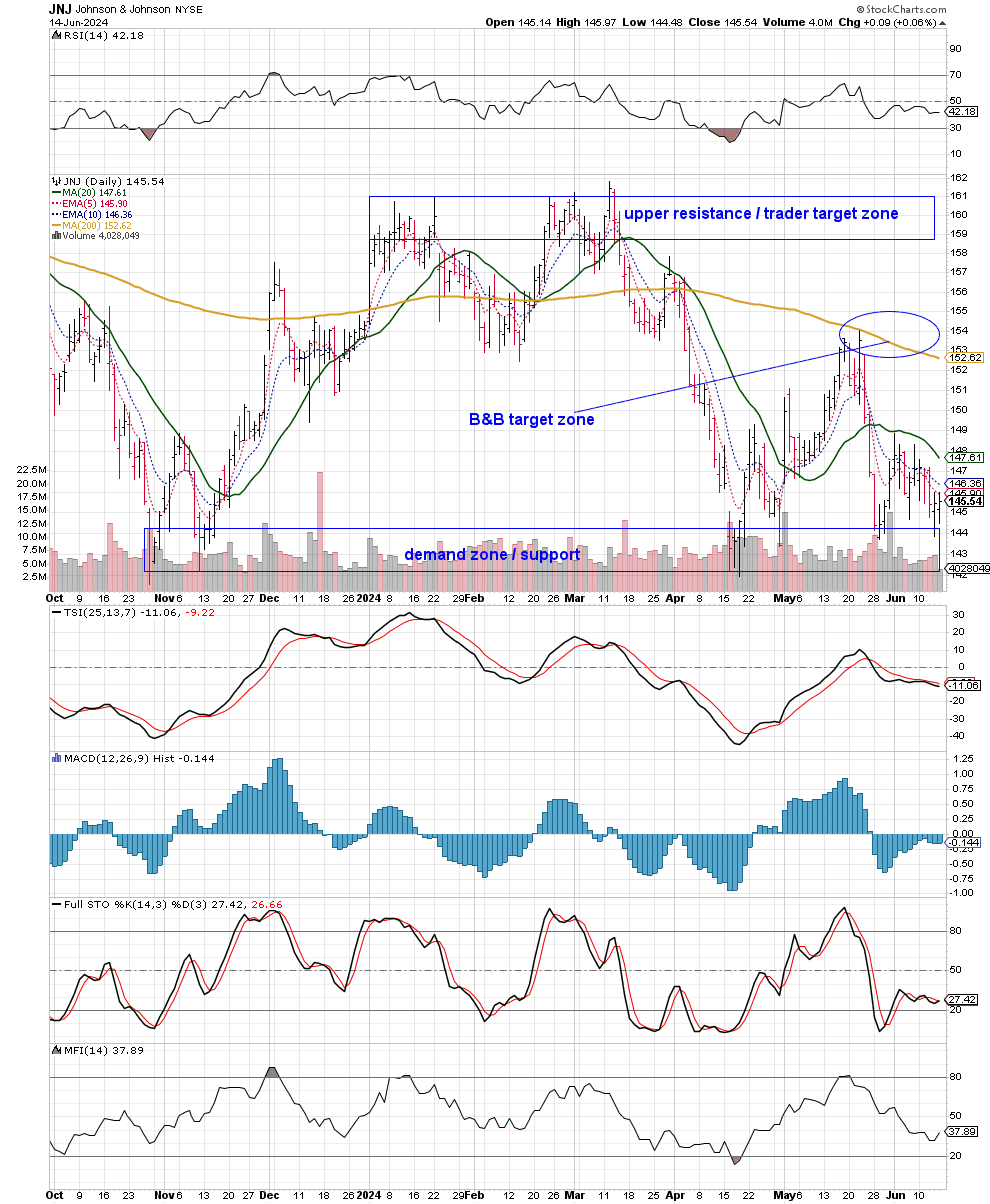
Support levels in the context of a demand zone can be understood as areas where buying interest is significantly strong enough to sustain or increase the price of a stock or asset.
Accumulation of Buy Orders: At support levels, there is typically a concentration of buy orders. This accumulation occurs because traders and investors perceive the lower prices as a good value, prompting them to buy rather than sell, believing that the risk of a further decline is limited.
Historical Precedent: Often, these levels are established through historical precedent where prices have stopped falling and reversed in the past. This historical memory leads to expectation and consequently, buyer behavior repeats when prices approach these levels again.
Self-Fulfilling Prophecy: The more frequently the price touches the support level without breaking it, the stronger the belief in this level's validity, potentially making it a self-fulfilling prophecy as more traders place buy orders at or near this price.
[See SOFI chart below with a demand zone, which takes months to form.]
[See JNJ chart below with a demand zone, which takes months to form.]
Purchase GP’s Trading Book: The Money Flow Trading System CLICK HERE!!
Resistance as Supply Zone
Resistance levels, seen as supply zones, are essentially the opposite of support levels. They represent areas where selling pressure overcomes buying pressure, thus capping price increases. Here's more on this concept:
Concentration of Sell Orders: Resistance levels are where sell orders are concentrated. As prices rise and reach these levels, sellers perceive the price as either too high relative to current fundamentals or attractive enough to lock in profits, thus increasing the selling pressure.
Historical Resistance: Similar to support levels, resistance is often established through past price actions where prices have previously peaked and reversed. This historical resistance informs trader expectations and influences market behavior at these levels.
Self-Reinforcing Nature: If a price fails to break through resistance levels multiple times, it reinforces the level's significance. This resistance can become more formidable as traders may place automated sell orders near these levels.
VERY IMPORTANT VIDEO ON SUPPORT & RESISTANCE!!!
This video includes a detailed explanation of support and resistance.
Make sure to get on the NEW PLATFORM email list! CLICK HERE!
View the FULL LENGTH of The Peters Report! CLICK HERE!
Applying Support & Resistance to The Money Flow
How understanding support and resistance—viewed as demand and supply zones—affects trading decisions
Entry and Exit Points:
Support Zones: These are seen as favorable areas for entering a long position or buying more of a security because the price is expected to rise after hitting support. Traders often feel confident buying at these levels because they are perceived as points where the price has stopped falling in the past.
Resistance Zones: Conversely, these are considered good spots for exiting a long position or initiating a short sell. As the price reaches a resistance level, it's often expected to stop rising and potentially start declining, making it a strategic point for selling or taking profits.
Breakouts and Breakdowns:
Breakout: When the price of a stock or asset breaks through a known resistance level and maintains its upward trajectory, it is considered a breakout. This suggests that the buying pressure was strong enough to overcome the sell orders at the resistance zone, potentially starting a new upward trend.
Breakdown: Similarly, if the price falls below a support level and continues downward, or “breaks the box”. This indicates that selling pressure has overwhelmed the buying interest at the support level, possibly signaling the beginning of a new downward trend.
These concepts are crucial for traders because they help in planning the timing and positioning of trades based on expected price movements as they approach these critical levels. By using support and resistance effectively, traders can better manage their risk and seek to optimize their return on investment.
Insights & Tools to gain a solid understanding of Support and Resistance
Understanding support and resistance is fundamental, but several additional layers can enhance your trading skills and decision-making process:
Multiple Time Frame Analysis
Analyzing support and resistance levels across multiple time frames can provide a more comprehensive view of potential price movements; for example, a resistance level that appears in both daily and weekly charts may hold more significance than one that appears only in an hourly chart.
Volume and Price Action
Volume is an important indicator that should be considered alongside support and resistance. High volume at a support or resistance level may indicate stronger interest and a potential for the level to hold. Conversely, a breakout or breakdown on high volume might suggest a more reliable, sustainable move beyond these levels.
Role Reversal between Support and Resistance
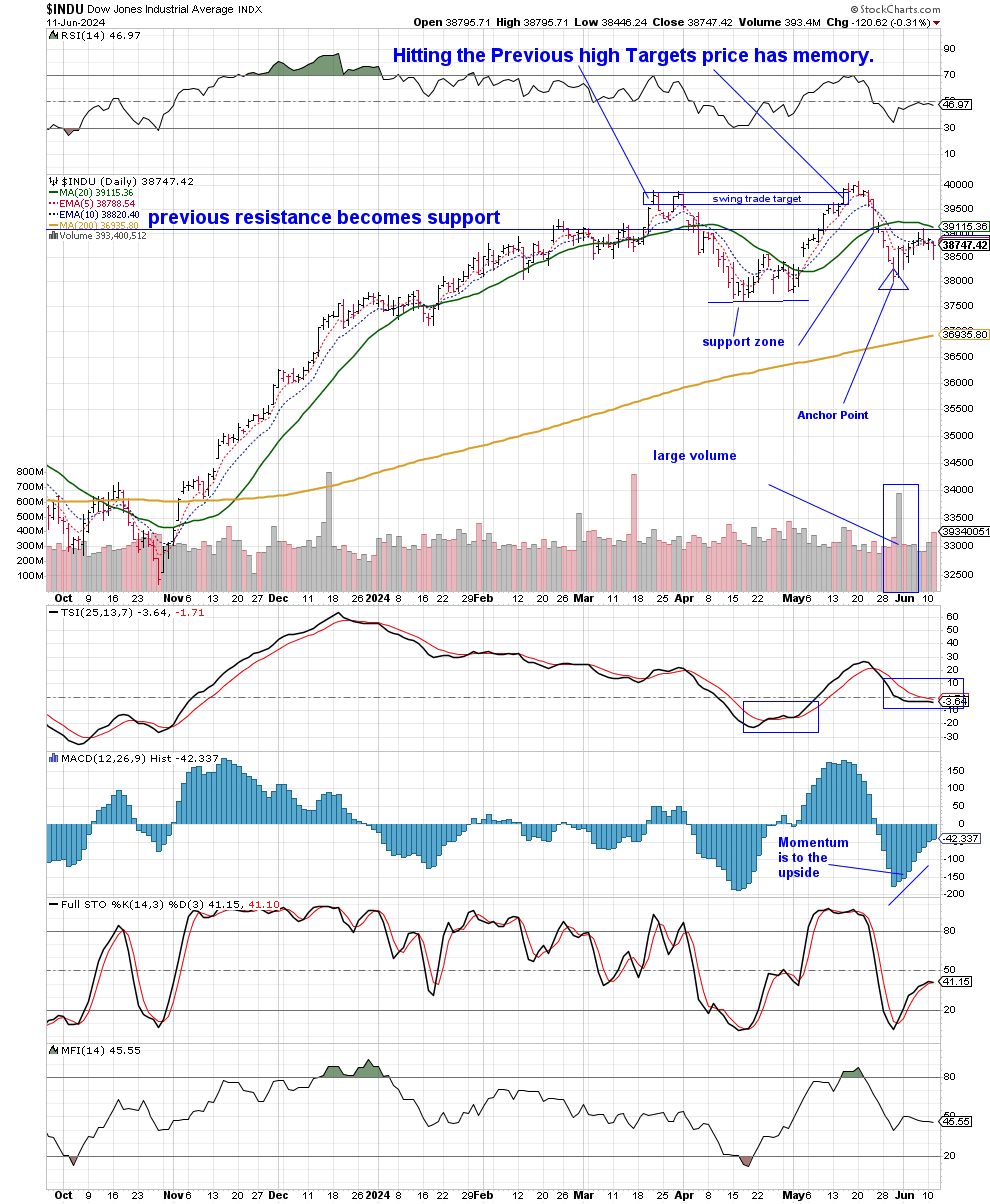
Once a resistance level is broken, it can often act as a new support level when the price retraces. Similarly, once a support level is broken, it can become a new resistance level.
This role reversal can be key to identifying entry and exit points post-breakout or breakdown.
Previous resistance becomes support. $INDU
Trend Analysis
Support and resistance are more effective when combined with trend analysis. Identifying the market trend (up, down, or sideways) can help you decide how to trade relative to support or resistance levels. In a downtrend, resistance levels may be more significant, while in an uptrend, support levels often hold more relevance.
By integrating these insights and tools with a solid understanding of support and resistance, you can enhance your trading approach, leading to more informed and potentially successful trading decisions in the stock market.
GP’s Support & Resistance Wrap-up
Support and resistance is one of the six basic money flow trading system technical indicators. You must take the time to study and understand these concepts. This is at the cornerstone of your success as a trader and an investor.
Let’s go, MFG! Keep pushing your intent into the universe.
Always remember, whatever you think about comes about, whatever you focus on grows. - GP
Looking for a group of likeminded people to trade with? Text alerts and the MFG Discord. Text GP 1-936-661-7786 or email GP fullauto11@gmail.com to join.




GANG GANG! Great explanation on support and resistance.
Thank you!