MFG STATE OF THE MARKET 6-2-24
The markets finished strong this past week with the S&P 500 (SPY) and The Nasdaq (QQQ) leading the Wind. Both assets tried to break down into a stage 4 decline, but closed right back in the stage 3 box on Friday; this is considered very bullish.
The stage 2 uptrend in Bitcoin (BTC) seems to be losing some momentum, but is still holding above its 20-day SMA. The Diamonds (DIA) look to be forming a new stage 1 accumulation zone along with Bonds (TLT) right at its 200-day SMA. OIL (USO) is also back in a stage 1 zone right above its 200-day SMA.
Gold (GLD) looks to be rolling over into a possible stage 4 decline. Be patient and stay in flow.
Make sure to get on the NEW PLATFORM email list! CLICK HERE!
Last week was an amazing week for the MFG portfolio. We had a couple beautiful green days while day trading and had what seemed like a historical day trading day on Friday!
The MFG has plenty of open trades right now. We're letting those play out and our winners run.
View the FULL LENGTH of The Peters Report! CLICK HERE!
Last week, I added to TSLR, TSLY, and GUSH. We saw nice breakout moves in VZ, WBD, T, CVS, GUSH, KO, NKE, AGNC, DRN, and HBI. This week, I'm keeping a close eye on CART, DASH, PEP, CELH, CRM, AMZN, ARKK, RDDT, and DNUT.
I'm looking to accumulate more shares of JNJ, BXMT, MCD, TLT, TSLR, CSCO, BMY, INTC, ROKU, SOFI, EB, and extreme-yield funds IWMY, TSLY, AMZY, GDXY, USOY, USOI, and USA.
Grab a free copy of Gerald’s ebook You Don’t Have To Die Broke! CLICK HERE!
Always remain bullish and follow The Money Flow.
The Peters Report - Stock & Crypto Trader’s Resource
-GP a.k.a Fullauto11
Looking for a group of likeminded people to trade with? Text alerts and the MFG Discord. Text GP 1-936-661-7786 or email GP fullauto11@gmail.com to join.
NEW ANNOUNCEMENT!!
My newest e-book, The Bread-And-Butter Trading System will be available for sale soon!! I’m not sure where that term came from, but bread and butter are staple American foods.
This strategy became my staple food- my go to strategy to add “alpha” to my buy and hold stock dividend portfolio. It literally became my bread-and-butter trading method.
Stay tuned for the release date and be among the first to get your copy. Don't miss out on this opportunity to step up your buy and hold portfolios and advance your trading skills.
Follow the MFG Substack to receive an exclusive discount and be notified as soon as the ebook is available!
MFG HW ASSIGNMENT!! 2 PARTS!!
THIS WEEK'S HOMEWORK VIDEO #1: CONFLUENCE!!
This week’s first video is on confluence, which is an area in the market where 2 or more structures come together to form a high probability buy or sell zone.
THIS WEEK'S HOMEWORK VIDEO #2: MASTERING THE SWING TRADE 101 - THE MONEY FLOW WAY!!
This week’s second video is on executing and mastering the perfect swing trade- the money flow way!!
Help Support the Newsletter!
Buy a signed physical copy of both Gerald’s books for only $87! $127 for international. Consider purchasing a copy for a friend and spread the wealth.
Looking for a group of likeminded people to trade with? Text alerts and the MFG Discord. Text GP 1-936-661-7786 to join.
Donations: Cashapp: $fullauto11 Venmo: @fullauto11
The Peters Report - Stock & Crypto Trader’s Resource
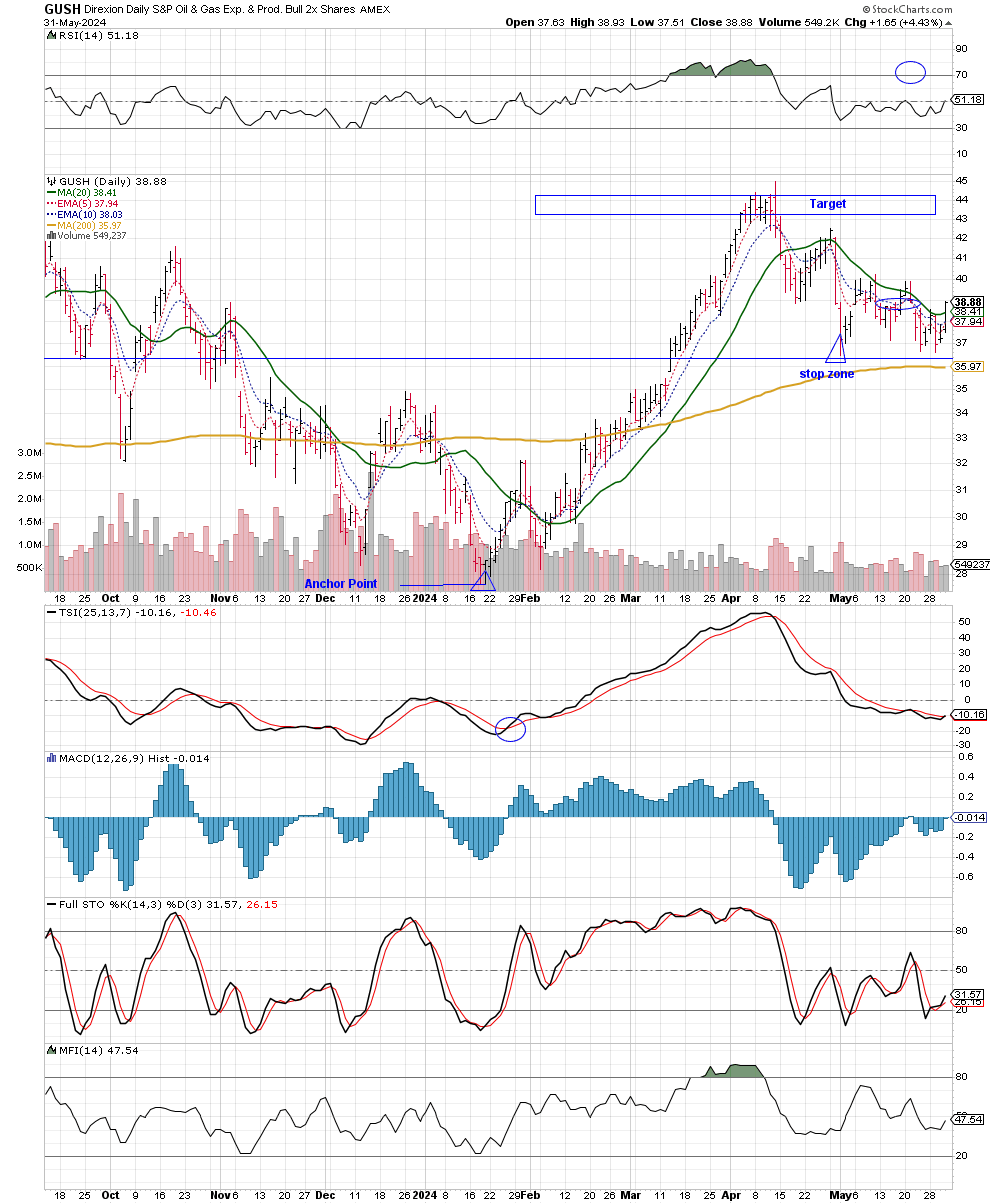
Trade ideas this week: GUSH, UBER, LYFT, CVS, TSLR, ROKU, ADBE, EB, CVS, INTC, BMY, DNUT
[See GUSH chart below with stop zone and targets.]
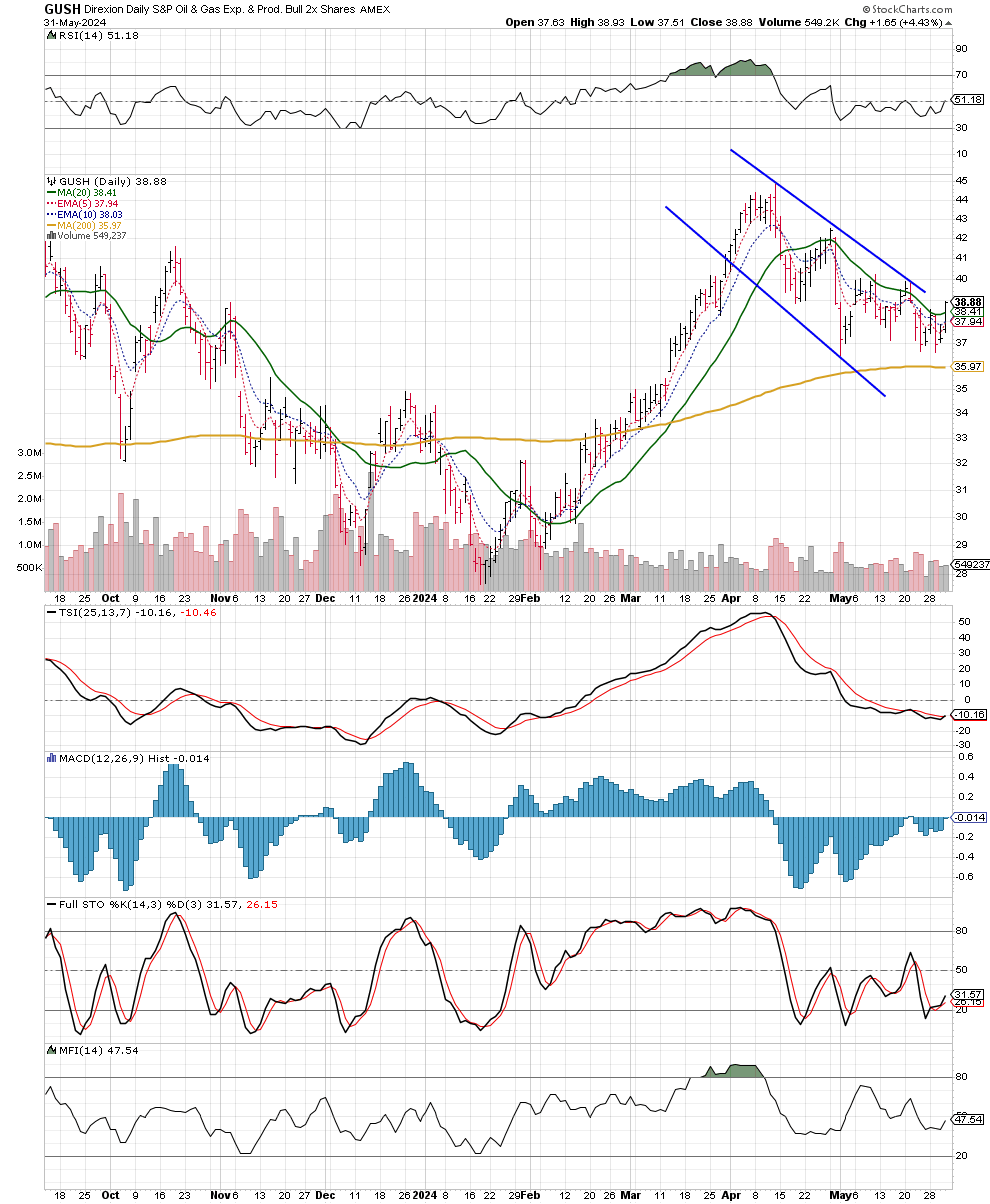
I’m looking for price to break above this downward-sloping channel.
[Downward-sloping channel in GUSH chart above]
Crypto trade ideas: WGMI, CLSK, MARA, RIOT, BITX, CONL
Dividend ideas: BXMT, JNJ, CSCO, INTC, DNUT, BMY
Top yielders I’m watching closely: TSLY, GDXY, AMZY, USA, USOY, USOI, DISO, PYPL
DOJI BAR (JESUS CROSS) EXPLAINED
A doji bar is a type of candlestick on a stock chart that looks like a plus sign (+) or a cross. It happens when the stock's opening price and closing price are almost the same.
This means the stock didn't move much up or down during that time period. It's important to know that a doji bar suggests that buyers and sellers are in an agreement of price.
This can mean that the current trend might be losing strength, and a change could be coming.
Let’s take a look at this CART chart below. Friday’s bar is a doji.
A doji bar in trading is a candlestick pattern that indicates indecision in the market. It forms when a stock's opening and closing prices are very close to each other, resulting in a small body.
This pattern suggests that buyers and sellers are balanced, and it can signal a potential reversal or continuation in the market trend, depending on the context of the surrounding price action.
View the FULL LENGTH of The Peters Report! CLICK HERE
As always, MFG- do your fucking homework! If you need help with getting started on your homework watch this video above and read my latest article about my step by step guide to completing your Money Flow Playbook! No more excuses!!
Always remember, whatever you think about comes about, whatever you focus on grows. - GP
NEW to trading and investing in stocks? Want a crash course? 12 videos and a 50 page manual- Getting Started with Stock Charts- The Money Flow Way: The Swing & Position Trading and Investment Blueprint. CLICK HERE


Need GP voice option for the auto play button 🤣🤙
Pumped for the new book!