The Peters Report: Midweek Market Update 10-23-24
Midweek market and trade updates to keep you in flow!!
Hey, MFG!
If you’ve followed me for a while, you know that every Sunday, I rank The Wind on my whiteboard, sorting the 7 asset classes tracked by the MFG from best to worst performers.
This method offers a great way to spot market rotations and get a clear view of the bigger picture—something I highly recommend!!
Need help ranking The Wind? Check out my step-by-step guide for a deep dive. CLICK HERE!!
Since I track these asset classes daily, I’m bringing you a midweek market update, along with some trade insights and recent moves I’ve made.
Let me know if these updates help you stay one step ahead. I truly appreciate your support and can’t thank you enough.
-GP a.k.a Fullauto11 🧙🐼
The Peters Report - Stock & Crypto Trader’s Resource
Always remain bullish and follow The Money Flow.
👉JOIN THE MFG DISCORD!!
Looking for a group of likeminded people to trade with? Text alerts and the MFG Discord. Text GP 1-936-661-7786 or email GP fullauto11@gmail.com to join.
🚀 Upgrade to The Peters Report – Trade of The Week!!
Unlock exclusive insights and advanced strategies by becoming a paid subscriber to The Peters Report. Stay one step ahead of the market with in-depth analysis and actionable tips designed to help you succeed as a trader and investor. Support the work that keeps you informed and ahead of the curve.
The Peters Report: Quick Market Update 10-23-24
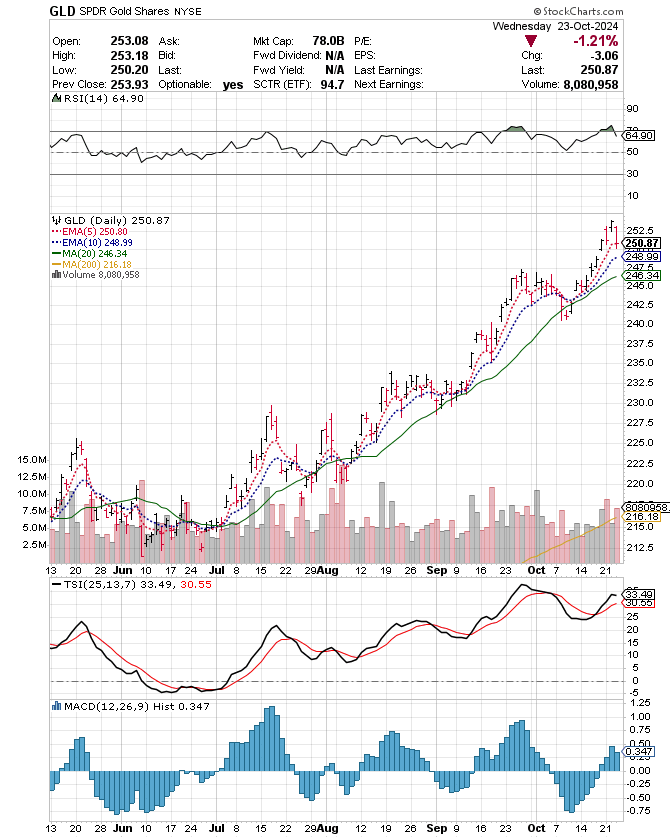
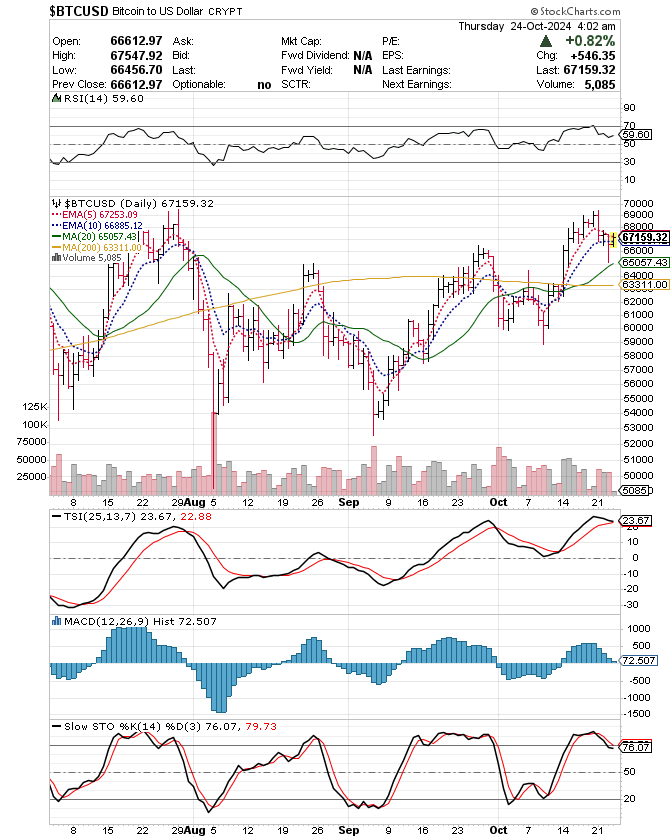
Gold (GLD) hit a new all-time high and banged an extreme-high RSI reading making it the top performing asset class of The Wind. The stage 2 uptrend in Bitcoin (BTC) just tagged an extreme-high RSI then lost its momentum.
I closed my October futures contracts because they were set to expire this week and I wanted to reduce my exposure. My Bitcoin and crypto swing trades are still open and running.
Grab a free copy of Gerald’s life-changing ebook You Don’t Have To Die Broke! CLICK HERE!
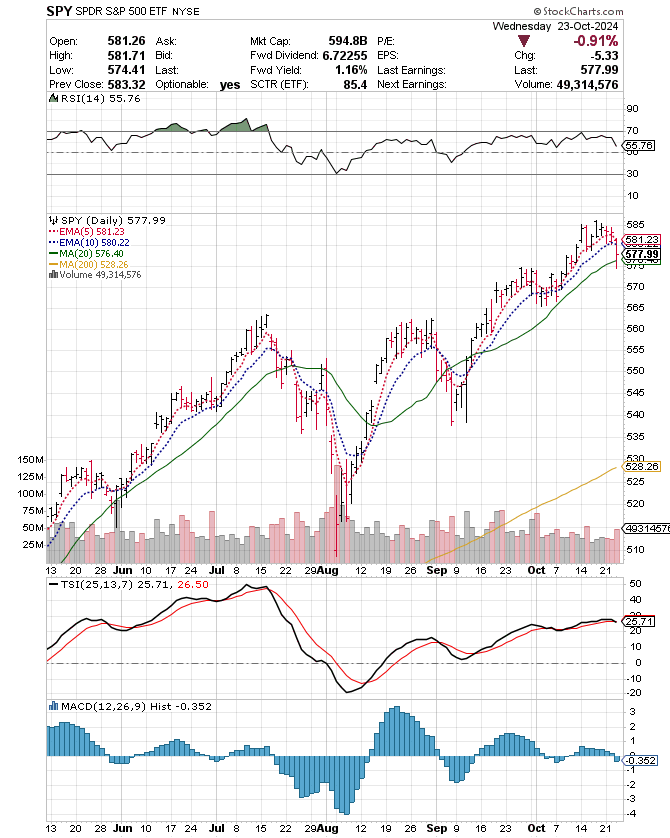
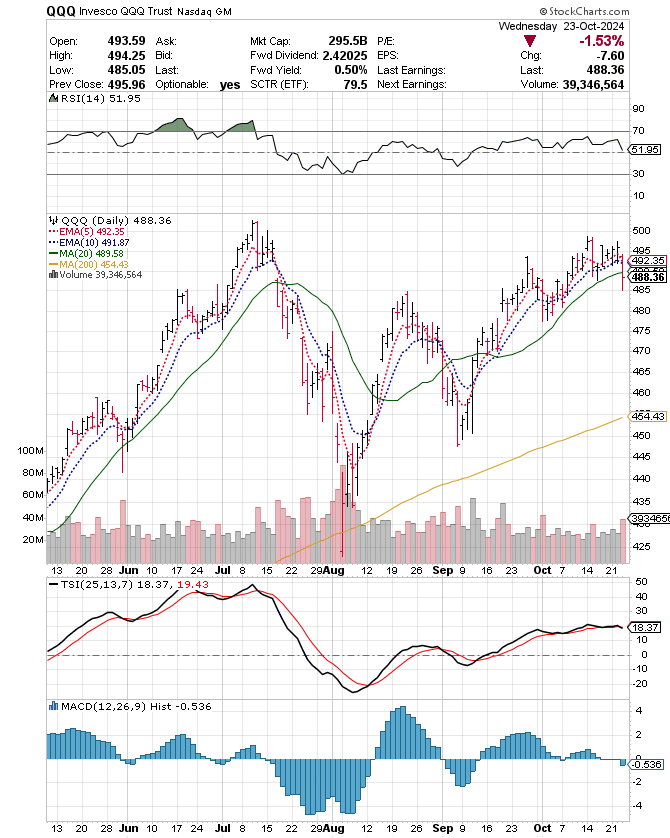
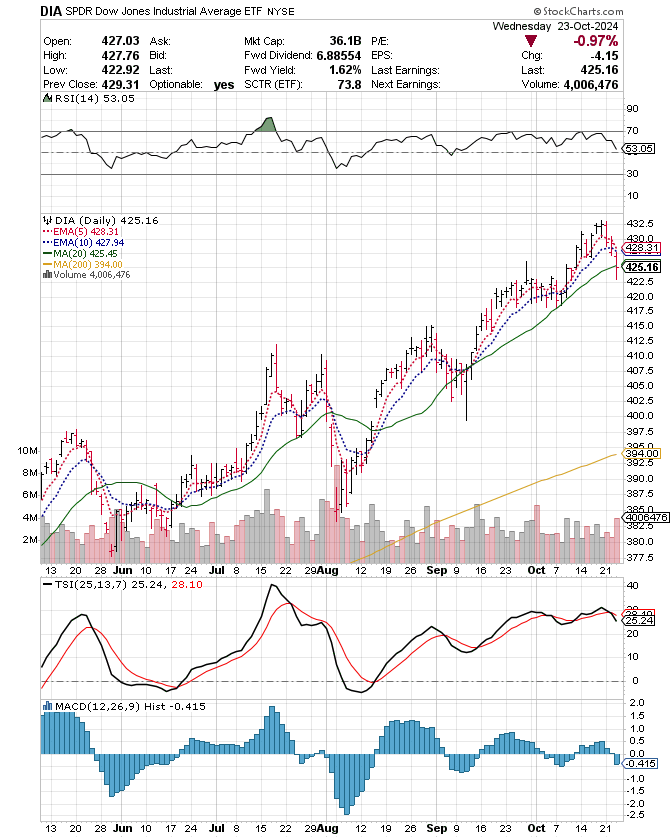
The major three indexes sold off today. The S&P 500 (SPY) tested its 20-day SMA, but closed above it. The Diamonds (DIA) and the Nasdaq (QQQ) both closed below their 20-day SMA.
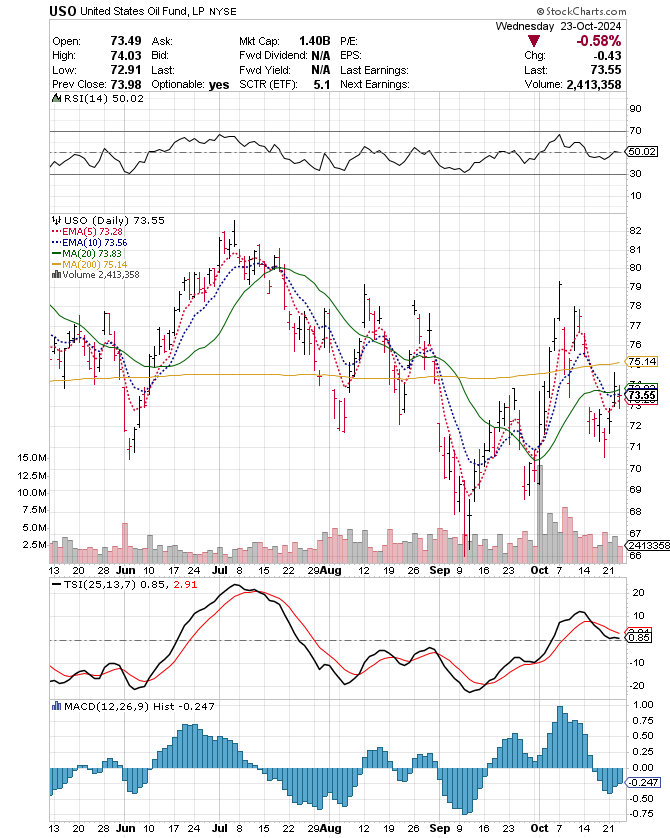
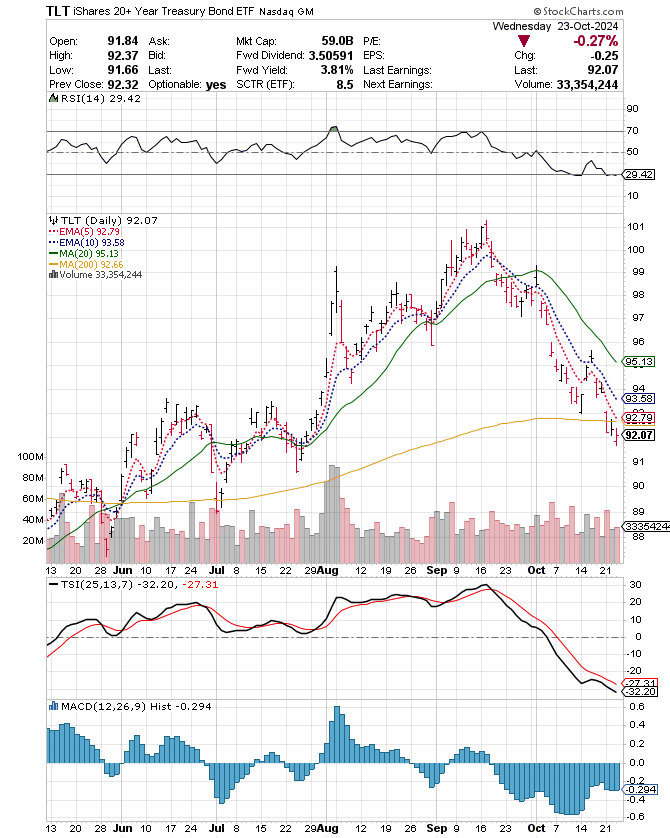
Oil (USO) is in a stage 1 accumulation zone with a possible stage 2 breakout underway right below its 200-day SMA. Bonds (TLT) are in a stage 4 decline and trading below its 200-day for the first time since July. The Russell 2000 (IWM) is also in a possible stage 4 decline.
Real Estate XLRE 0.00%↑ , Utilities XLU 0.00%↑ , and Financials XLF 0.00%↑ were the best performing sectors of the S&P 500, while Consumer Discretionary XLY 0.00%↑ , Technology XLK 0.00%↑ , and Communication Services XLC 0.00%↑ were the worst.
There has been a market rotation here into value laggard stocks.
Ranking The Wind everyday is what keeps me in flow and one step ahead of the markets.
👉👉So far this week, I closed my Trade of The Week ABNB 0.00%↑ for a nice gain. I’m watching ADBE 0.00%↑ closely here for a possible stop out. I cut my position in BARK 0.00%↑ in half since it hit its stop loss zone. I’m looking to add to OXY 0.00%↑ .
👉👉Let’s dig into how I viewed The Wind tonight.
Quick Daily Ranking of The Wind
GLD GLD 0.00%↑
BTC ($BTCUSD)
SPY SPY 0.00%↑
QQQ QQQ 0.00%↑
DIA DIA 0.00%↑
USO USO 0.00%↑
TLT TLT 0.00%↑
[See 1. GLD chart below.]
Gold (GLD) is the leading asset class of The Wind so far this week. It has hit another new all-time high and extreme-high RSI reading. I’m in the 3x leveraged gold trade UGL and I’ve been letting my position run.
[See 2. $BTCUSD chart below.]
The stage 2 uptrend in BTC has lost some momentum. Price recently tagged an extreme-high RSI and hit previous highs so I closed my October futures contracts that were set to expire this week. I kept my crypto trades on and haven’t trimmed any positions yet.
[ See 3. SPY chart below.]
The S&P 500 (SPY) looks like it wants to rollover here. It tested its 20-day SMA, but closed above it. The TSI is about to cross and the MACD histogram is on the bearish side pointing downward. Let’s see where price closes tomorrow.
[See 4. QQQ chart below.]
The Nasdaq (QQQ) is entering a possible stage 4 decline. Price closed below its 20-day SMA and the Money Flow indicators are rolling over. If price closes below today’s candle, tomorrow, then it will be a confirmed stage 4 decline.
[See 5. DIA chart below.]
The Diamonds (DIA) is also entering a possible stage 4 decline. Price closed below its 20-day SMA and the Money Flow indicators are rolling over. If price closes below today’s candle, tomorrow, then it will be a confirmed stage 4 decline. Let’s see how the markets move tomorrow.
[See 6. USO chart below.]
Oil (USO) is back in a stage 1 accumulation zone right below its 200-day SMA. Price tried to breakout yesterday, but came back into the box today and closed with a doji. Oil could be the play here. A possible stage 2 is underway. I’ve been accumulating OXY here. I’m in it in my buy and hold account and as a swing trade.
[See 7. TLT chart below.]
Bonds (TLT) are in a steady stage 4 decline and now trading below its 200-day SMA at an extreme-low RSI reading. I will be looking to add to my 3x leveraged bonds trade TMF when price stops dropping and sets up. This could be a nice opportunity in bonds here. I’ve been building my position for three years now.
GP’s Wrap Up 🌊
It looks like we are seeing a rotation here into safer, value laggard stocks. I really like CPB, MO, DG, KLG, HUM, MDLZ, and CUBE.
No one knows where the markets are going!
I hope these breakdowns of The Wind help you.
As always, feel free to reach out with any questions in the comments, or text me—your engagement helps us navigate the markets together!!
Where two or more are gathered, there is power!!
Always remember, whatever you think about comes about, whatever you focus on grows. - GP 🐼
Looking for a group of likeminded people to trade with? Text alerts and the MFG Discord. Text GP 1-936-661-7786 or email GP fullauto11@gmail.com to join.
Purchase GP’s Trading Book: The Money Flow Trading System CLICK HERE!!
Book a 1:1 Phone Consult with GP to Discuss Your Trading CLICK HERE!!
NEW to trading and investing in stocks? Want a crash course? 12 videos and a 50 page manual- Getting Started with Stock Charts- The Money Flow Way: The Swing & Position Trading and Investment Blueprint. CLICK HERE


🔥🔥🔥🔥🔥🔥🔥🔥
YES YES YES