Hey, MFG!
YES! YES! YES!
If you have been an astute student of mine for a while now, you know that I rank “The Wind” on my whiteboard every Sunday.
I rank the 7 asset classes tracked by the MFG from best performing asset to worst. I highly recommend you do this to learn to spot market rotation and see the bigger picture.
If you need help with ranking “The Wind,” check out my article with step by step instructions. CLICK HERE!!
I track “The Wind” everyday. Tonight, I wanted to give you a quick update of what I’m seeing in the markets.
Let me know in the comments if you dig these midweek market updates. I appreciate you.
-GP a.k.a Fullauto11 🧙🐼
The Peters Report - Stock & Crypto Trader’s Resource
Always remain bullish and follow The Money Flow.
👉JOIN THE MFG DISCORD!!
Looking for a group of likeminded people to trade with? Text alerts and the MFG Discord. Text GP 1-936-661-7786 or email GP fullauto11@gmail.com to join.
NEW ANNOUNCEMENT!!
🚀 Upgrade to The Peters Report – Now Monetized!
Unlock exclusive insights and advanced strategies by becoming a paid subscriber to The Peters Report. Stay one step ahead of the market with in-depth analysis and actionable tips designed to help you succeed as a trader and investor. Support the work that keeps you informed and ahead of the curve.
The Peters Report: Quick Market Update 9-4-24
On the first trading day of September, the major 3 indexes tracked by the MFG, including The Dow Jones (DIA), the S&P 500 (SPY), and the Nasdaq (QQQ) fell and “sold off.”
The Big 3 indexes had their worst day since the Japanese Carry Trade “mini crash” on Monday, August 5th, most likely due to a weak manufacturing data report.
Commodities sold off as well with Copper (CPER) down 2.90% and Oil (USO) down 4.4% having it’s worst day since December, while the U.S. dollar (UUP) climbed higher.
Consumer staples (XLP) was the best performing sector of the SPY, while technology (XLK) was the worst. Most of the sectors of the SPY closed down for the day. Energy (XLE) and Technology (XLK) were the two worst performing.
Some top performing stocks of the MFG portfolio for the day were utility stocks (DUK, SO, AEP), VZ, MO, JNJ, PG, WMT, KO, and TAP.
With all that being said, this is just one day in the stock market.
This doesn’t mean the rally is over, but to use caution when placing trades. Watch the markets and make sure “The Wind” is in your favor before entering a trade or adding to a position.
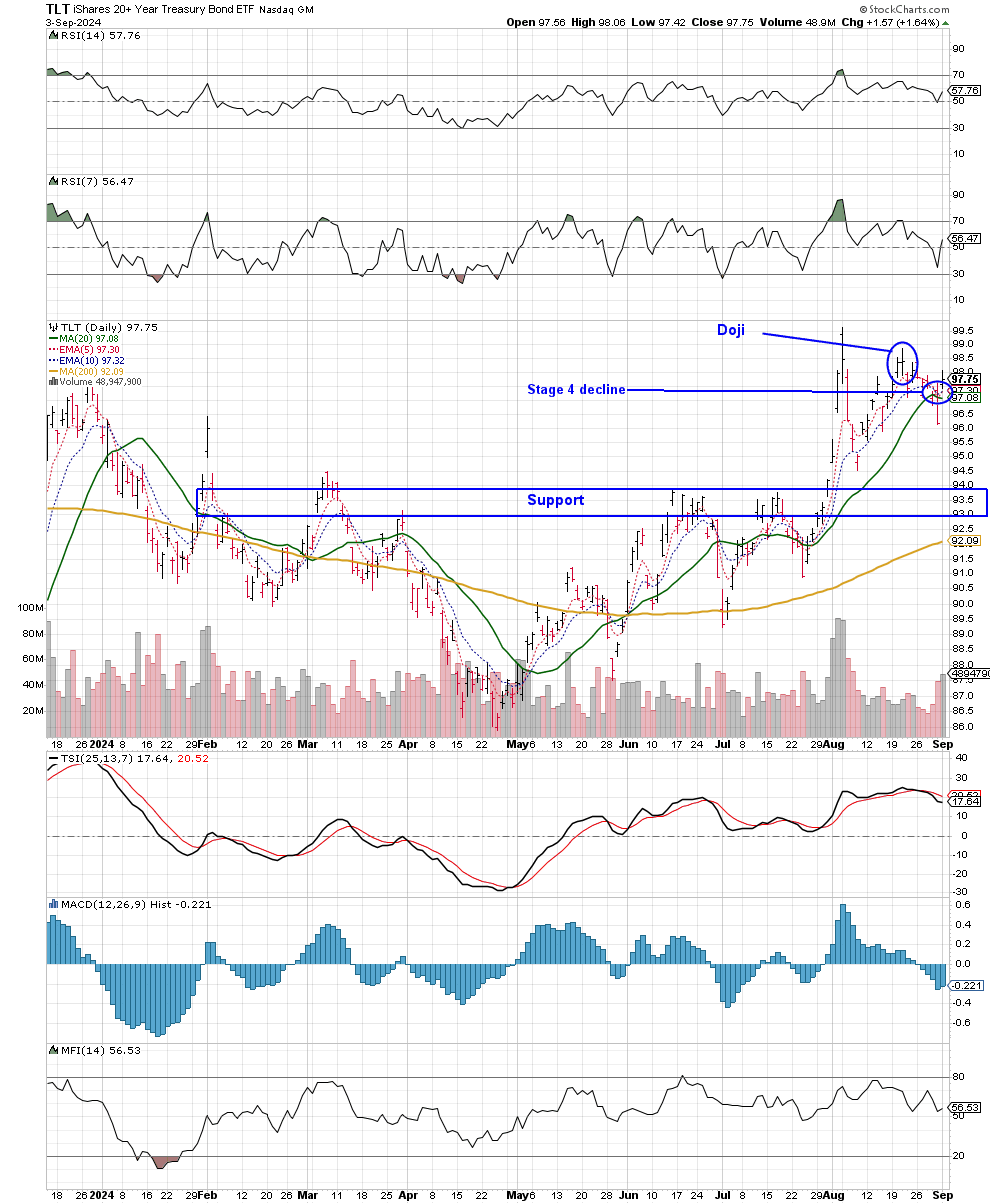
On a more positive note, Bonds (TLT) came back into the box today! This is super bullish. I’m watching bonds closely here to see if they hold here or rollover. I’ve been building my 3x leveraged bonds trade TMF TMF 0.00%↑ for three years now.
Grab a free copy of Gerald’s life-changing ebook “You Don’t Have To Die Broke!” CLICK HERE!
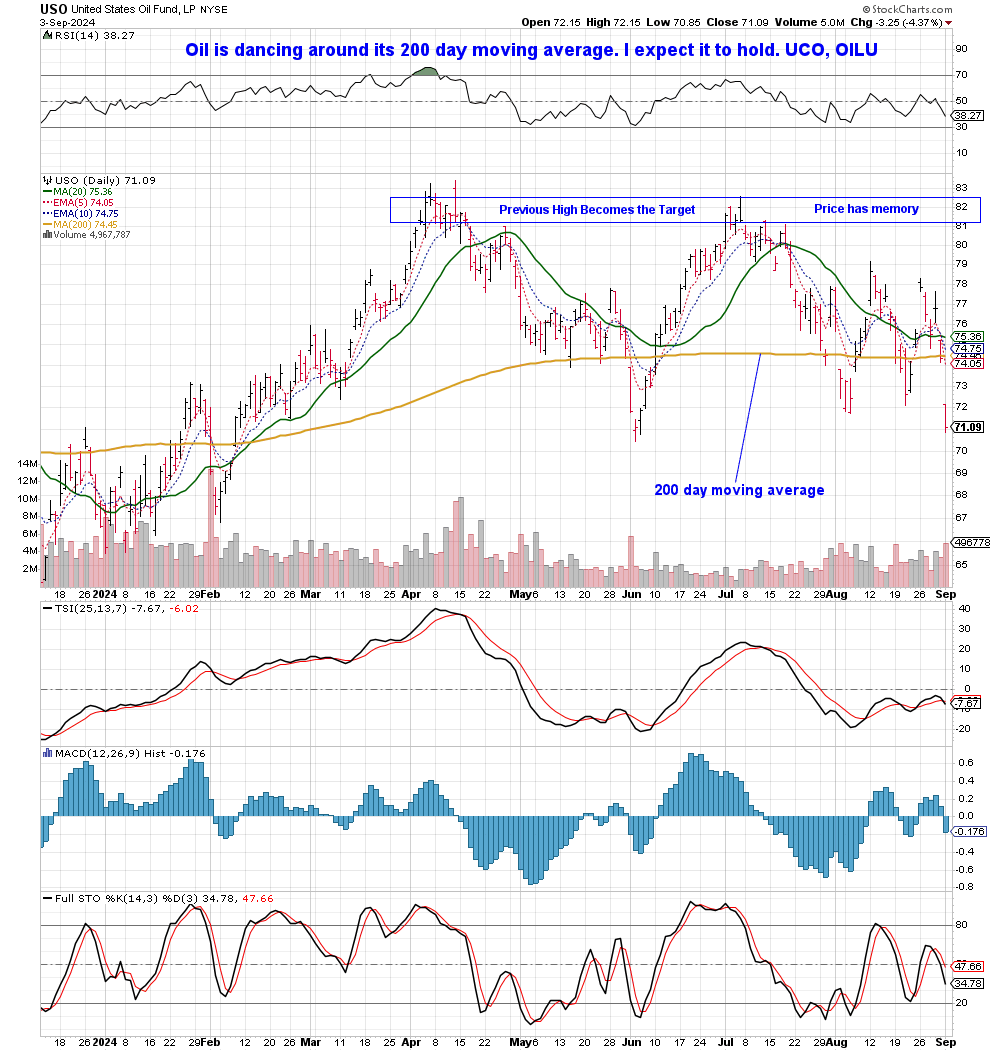
A stage 4 is underway in Oil (USO) below its 200-day SMA. Most oil stocks (XLE) have been outperforming the commodity itself. I’m looking to add to oil stocks this week.
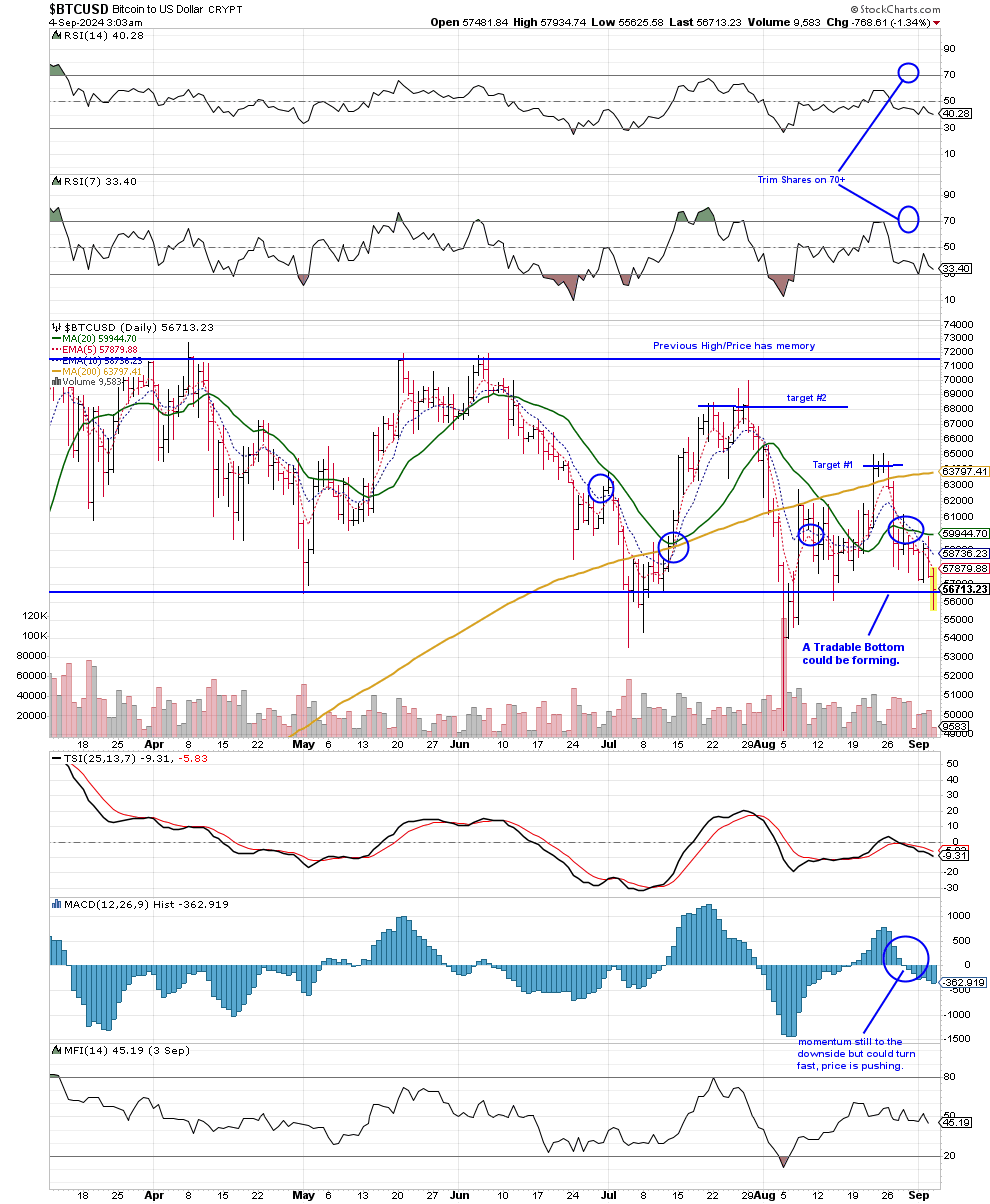
Bitcoin (BTC) is still holding its anchor point. I’m watching closely here to see if price holds this stage 1 accumulation zone or rollovers. I’m a buyer of BTC and Bitcoin Cash (BCH) on all stage 1s. I’ve been dripping buying here.
Again, use caution here while playing trades in these market conditions.
Don’t rush into any trades here. There’s never a rush in the stock market. There’s always an opportunity or another hot stock. You should never be in a rush. Let the setups come to you.
My trade ideas this week include GOOX GOOX 0.00%↑ , AMZU AMZU 0.00%↑ , ABNB ABNB 0.00%↑ , and KSS KSS 0.00%↑ B&B Trade.
Let’s dig into how I viewed “The Wind” tonight.
Quick Daily Assessment of “The Wind” Ranking
TLT TLT 0.00%↑
DIA DIA 0.00%↑
GLD GLD 0.00%↑
SPY SPY 0.00%↑
QQQ QQQ 0.00%↑
BTC ($BTCUSD)
OIL USO 0.00%↑
[See TLT chart below.]
Bonds (TLT) was the leading asset class today. Price came back into its stage 3 box, which is super bullish. TLT is trading above its 200-day SMA at a 57 RSI reading. Let’s see if price holds here.
[See DIA chart below.]
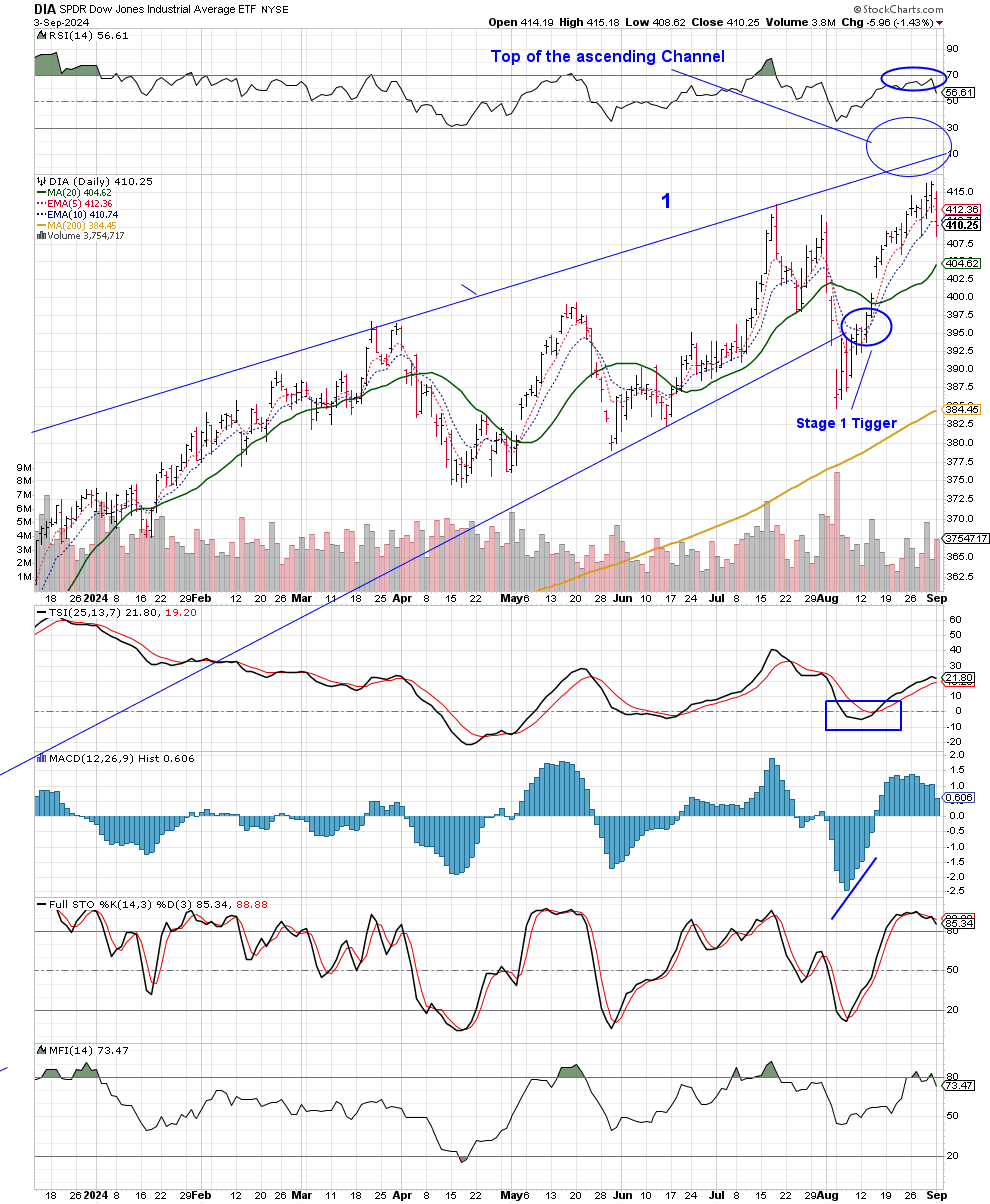
The Dow Jones (DIA) closed lower today; however, it’s still in a stage 2 uptrend and never hit an extreme-high RSI reading here, which means price has room to continue higher. Stay bullish here.
[See GLD chart below.]
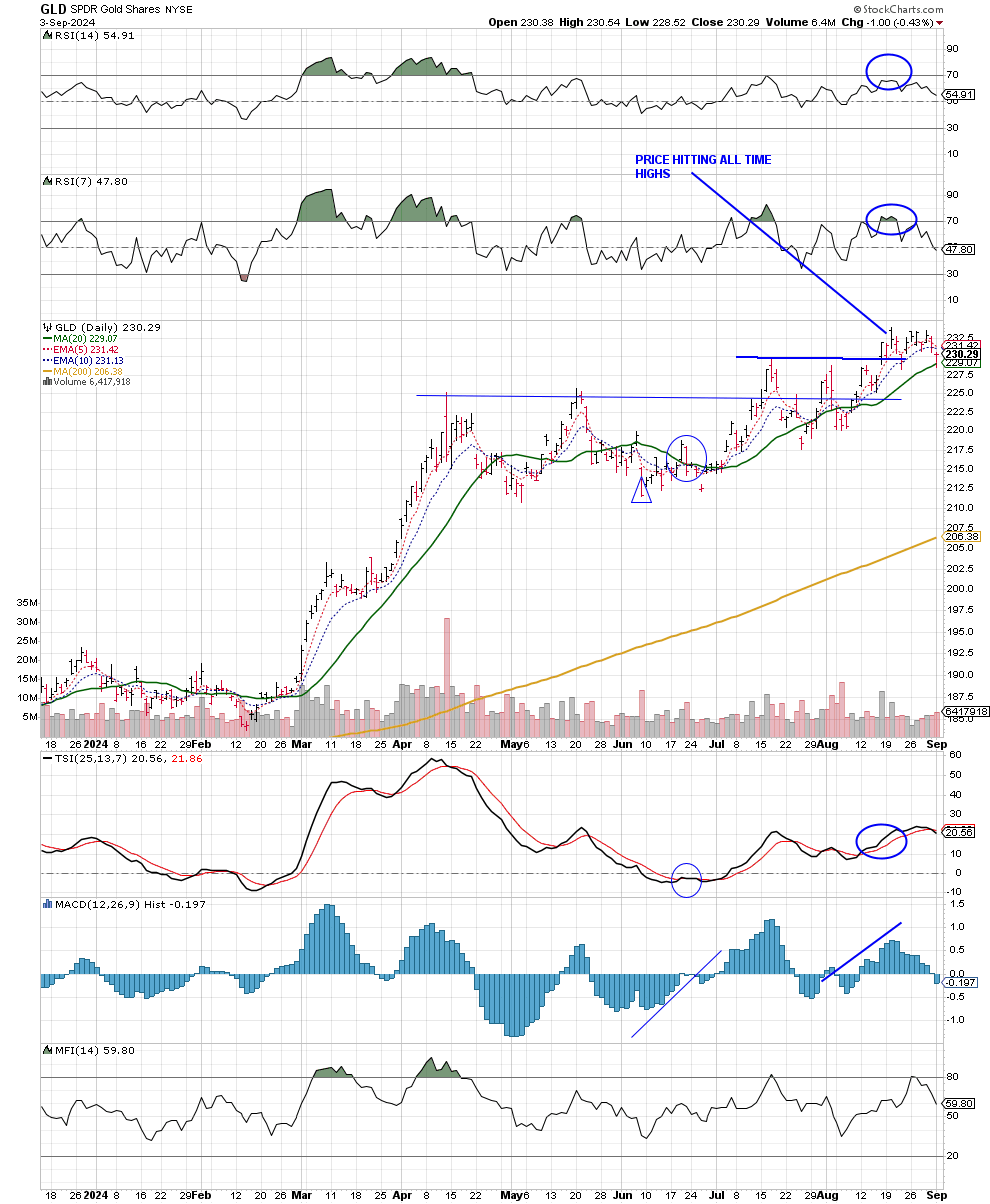
Gold (GLD) is holding its stage 3 consolidation zone here. Price last closed with a doji bar. Let’s see if price holds here or rollovers into a stage 4 decline.
[See SPY chart below.]
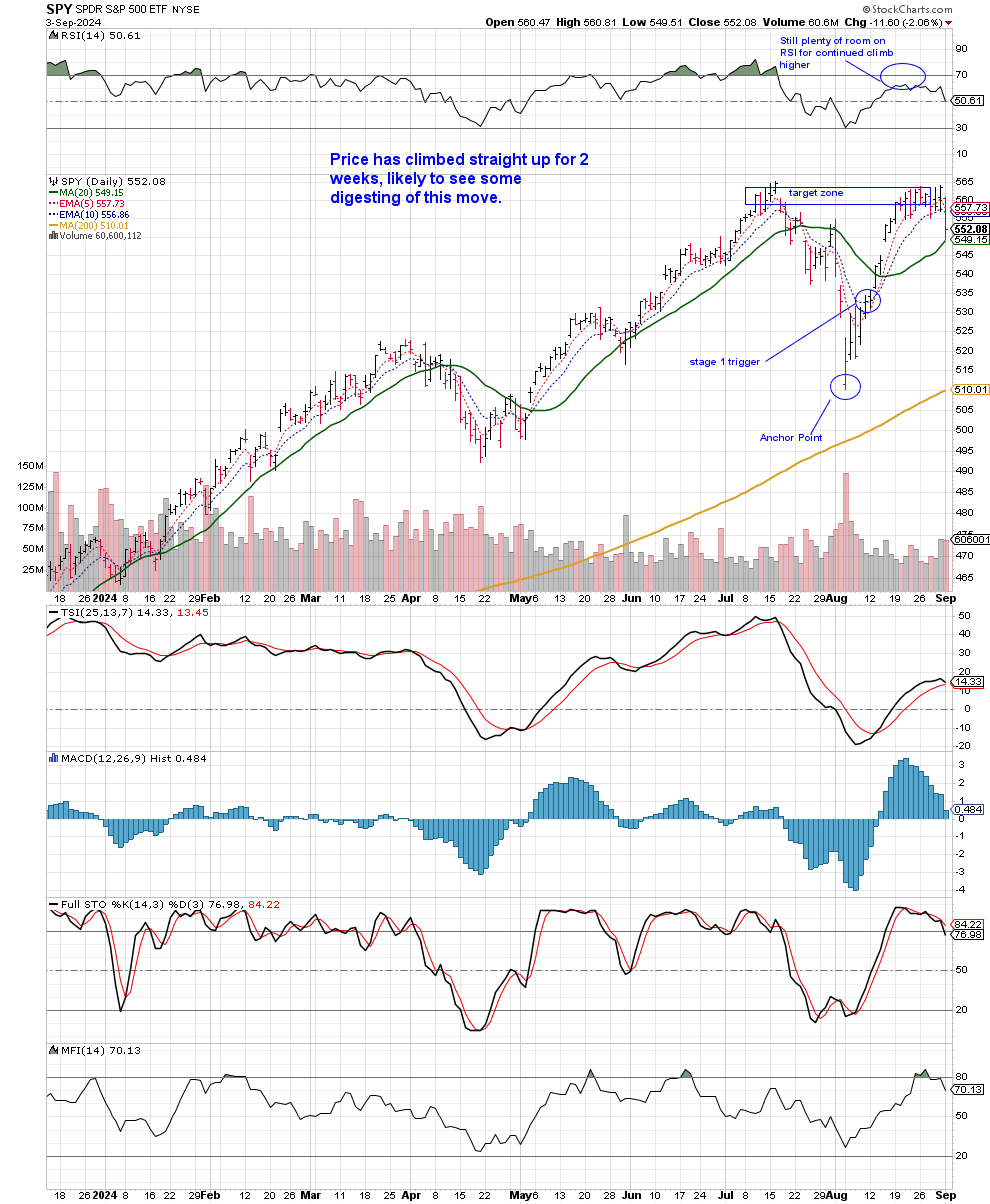
The S&P 500 (SPY) fell; however, it tested its 20-day SMA, but still closed above it. This is a good sign. The RSI still has a lot of room for price to climb higher. Again, stay bullish here!
[See QQQ chart below.]
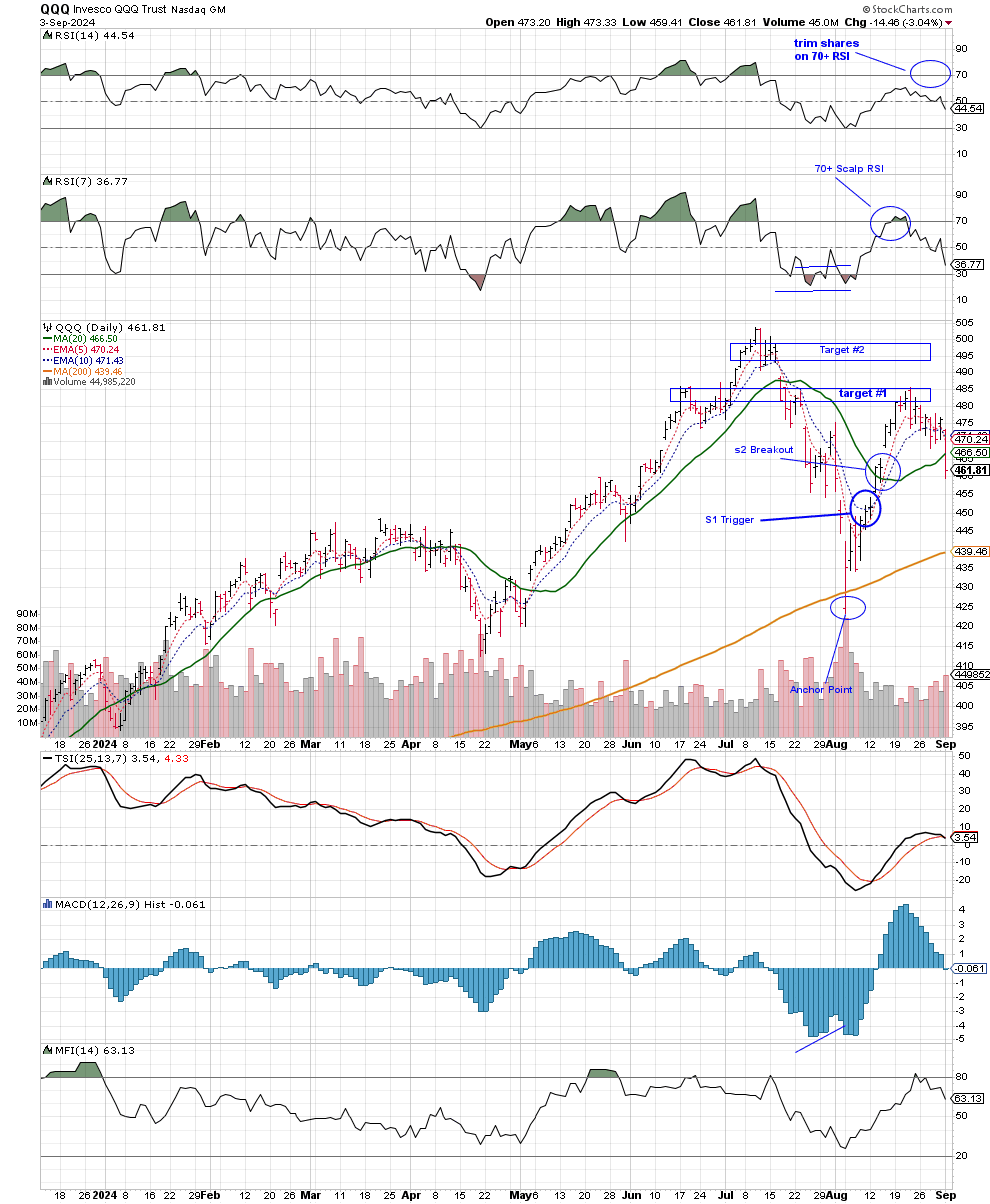
The Nasdaq (QQQ) closed below its 20-day SMA with most of The Money Flow indicators pointing down. This is bearish, but I would like to see what price does this week before coming to any conclusions.
[See BTC chart below.]
I’m going to be honest, I don’t like this Bitcoin (BTC) setup here. Even though price is holding its anchor point, it’s almost breaking its tradable bottom with all of The Money Flow indicators point down.
[See USO chart below.]
Oil (USO) has been trading around its 200-day SMA. Price broke its anchor point and entered a stage 4 decline. This reflects in the US Dollar (UUP) being up.
I rank “The Wind” daily. It helps me see the bigger picture and stay one step ahead of the markets. It’s a great daily practice to perform. Let me know in the comments if you have any questions about ranking “The Wind.”
Always remember, whatever you think about comes about, whatever you focus on grows. - GP
Looking for a group of likeminded people to trade with? Text alerts and the MFG Discord. Text GP 1-936-661-7786 or email GP fullauto11@gmail.com to join.
NEW to trading and investing in stocks? Want a crash course? 12 videos and a 50 page manual- Getting Started with Stock Charts- The Money Flow Way: The Swing & Position Trading and Investment Blueprint. CLICK HERE


Thanks to you, GP I’ve gotten in the habit of ranking The Wind everyday. 🔑🔑
THANK YOU 🙏